Homelab Anomaly Detection
PAUSED · WORKING MVP · JUNE 2026A TranAD anomaly-detection pipeline adapted to my own server's telemetry - Prometheus in, model scores back out, alerts in Discord.
Python · PyTorch · FastAPI · Prometheus · Grafana · Docker · TranAD
Why this exists
This started as a take-home-style project built on Striim Labs’ TranAD prototype during an application process. I ended up enjoying the ML side enough that I kept going and pointed it at a real problem I had: my server lives at my family’s home in San Jose, and I was in LA. The machine runs a dozen services, including media streaming, so raw resource graphs are noisy by design - what I wanted was something that could tell the difference between “someone is watching a movie” and “something is actually wrong,” and message me about only the second kind.
What I started from, and what I added
The fork gave me a working TranAD implementation: training with a train/test split, threshold calculation, evaluation against labeled anomalies, and a FastAPI scoring service. My work (20 commits over the upstream prototype’s 26) was making it real on my hardware:
- A Prometheus
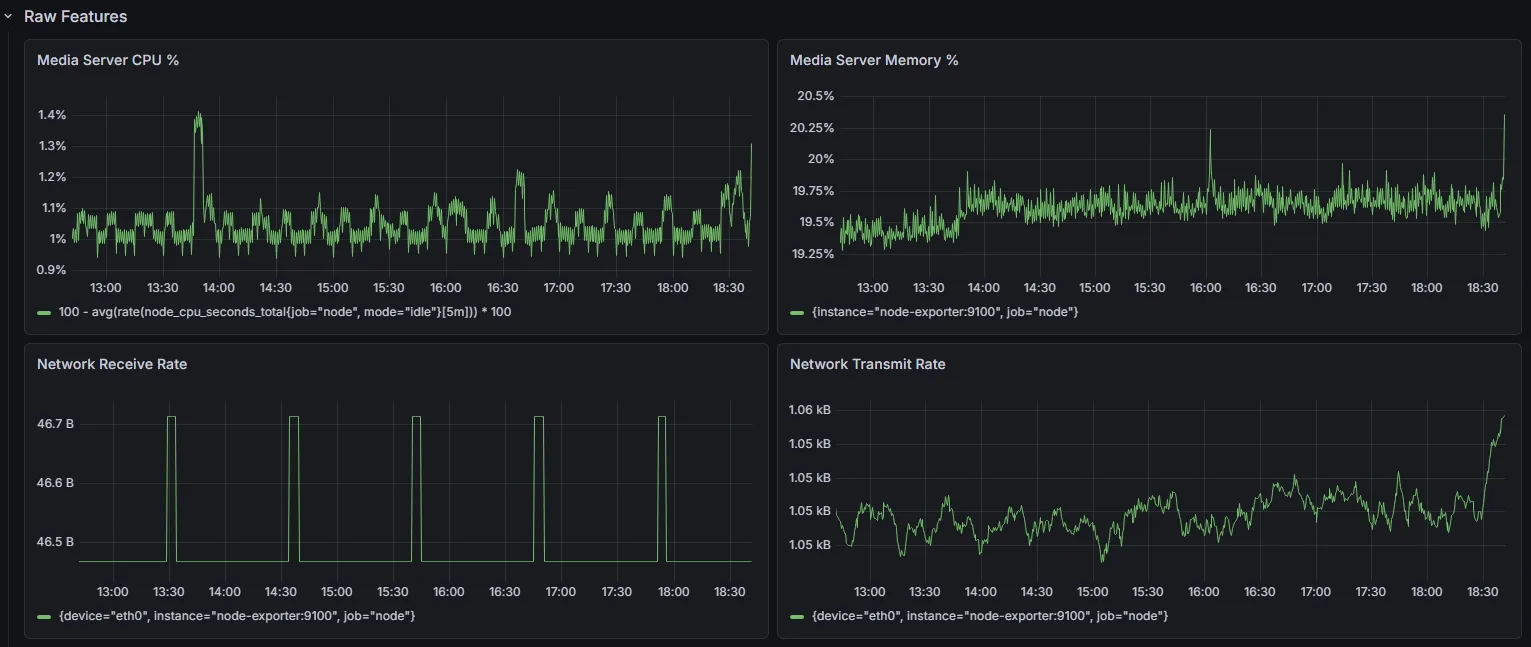
query_rangeexport pipeline that pulls two weeks of media-server telemetry - CPU, memory, network receive, network transmit. - A homelab preprocessing script: train-set min/max normalization, sliding windows, and synthetic anomaly injection (the upstream prototype had no injection - its benchmark data came pre-labeled; my telemetry did not).
- Training and evaluation on the real telemetry (~2,823 rows, 4 features, 30 epochs, CPU only).
- A
machineidentifier added to the scoring API schema, a continuous scrape-and-score loop, and an exporter that publishes model score, threshold, and anomaly ratio back into Prometheus. - Grafana dashboards and alert rules on top, with notifications pushed to Discord.
Preprocessing choices
Two decisions worth explaining, both inherited from the paper’s approach and kept because they made sense here:
Min/max normalization from the training set. The four features live on wildly different scales - percentages for CPU and memory, raw bytes for network counters. Normalizing everything to 0-1 lets the model weigh them comparably. The min/max values come from the training split only, so the test data can’t leak information into the scaling.
Sliding windows (size 10). TranAD scores a window of recent history, not a single point. That’s what lets it treat context as signal: a value that looks fine in isolation can be anomalous at the end of a steady climb, and a spike can be normal if the window shows it happens every night at the same time.
Synthetic evaluation
I never had a real incident on record, so the test labels are injected. The preprocessing script plants three anomaly shapes in the test split:
- a CPU spike (usage tripled for 12 intervals, clipped at 100%),
- memory pressure (multiplied 1.6x for 24 intervals),
- a network burst (receive and transmit multiplied 10x for 18 intervals).
Against those labels the model detected 42 of 54 anomalous rows with 3 false positives, using a POT (peaks-over-threshold) threshold of 0.3138. The metrics above are exactly that: performance against synthetic anomalies on a single machine with four features and two weeks of history. Most of the misses were in the CPU spike - the weakest of the three patterns for this model on my data.
Running it for real
The scoring service and exporter run in Docker on the same machine they monitor, and Grafana alerts route to Discord: a warning when the model score sits above the learned threshold, critical when it holds 50% above threshold for five minutes.
TranAD Critical Anomaly · severity=critical
summary: The model score is 50% above threshold for 5 minutes
machine=media-server · service=tranad-api
Honest operational result: it currently over-alerts. The model trained on two quiet weeks, so it learned a baseline where almost nothing happens - and now flags stretches of ordinary activity as anomalous. That’s the real lesson of the project so far: the synthetic evaluation numbers say the model can find planted anomalies, and live operation says the baseline isn’t representative yet.
Status and next steps
Paused at a working MVP since late June 2026, deliberately: I want a longer span of telemetry before retraining, and I’m now collecting NAS disk read/write metrics to add as features. The retrain against that data - and recalibrating the threshold against real activity patterns instead of a quiet fortnight - is the next step. Kafka/Spark streaming and a baseline model comparison (Isolation Forest) are on the list but not started.
Changelog
- Prometheus query_range export pipeline for media-server telemetry
- Homelab preprocessing script - normalization, windowing, synthetic anomaly injection
- Trained on ~2 weeks of real telemetry; ran evaluation, extended the scoring API schema
- Continuous scrape-and-score loop plus Prometheus exporter for model output
- CPU-only PyTorch Docker image; paused at working MVP
- Grafana alert rules routing warning/critical anomalies to Discord